A company can report 100% renewable electricity across the year and still pull grid power through most winter evenings, once the solar has dropped off. Annual matching hides that. The GHG Protocol Scope 2 update and the SBTi's new standard are both pushing corporate reporting towards hourly detail, and buyers are starting to ask what their real, hour-by-hour position looks like.
In June 2026, the Climate Group reported that more than 1,500 businesses now record their electricity use on an hourly matched basis, three times as many as a year earlier. The renewable energy case studies, or carbon-free energy examples, below show companies at different stages of that shift, and what an hourly CFE score reveals that an annual one misses.
Key takeaways
- A CFE score is the share of your consumption matched by carbon-free generation in the same location and hour, not across the year. A portfolio can show 100% annual coverage yet only 40–65% hourly.
- Technology mix is the biggest lever. At 100% annual coverage, a solar-only portfolio scores 41–44% hourly, a wind-only portfolio scores above 70%.
- Platforms like Renewabl Track help corporates cut through this uncertainty by centralising data and providing real‑time CFE reporting.
- The three examples below include: a data centre moving to hourly PPA tracking, a consumer goods pilot that hit a 69% hourly and 74% monthly match, and a distributor centralising EACs across 40+ sites.
- The proposed approach is not not all-or-nothing. For many buyers the sensible first move is annual to monthly, with hourly as the direction of travel.
What an hourly CFE score actually measures
A CFE (Carbon-Free Energy) score is the share of your electricity consumption matched by carbon-free generation in the same hour, not across the year. It is the difference between "we bought enough clean power over twelve months" and "our demand was met by clean power at 2am in January".
Annual and hourly numbers diverge more than most buyers expect. At 100% annual renewable coverage, a solar-only portfolio typically scores 40–44% on an hourly basis. A wind-only portfolio on the same volume scores above 70%.
In another recent analysis we completed, an in-country wind-and-solar mix reached 82% on hourly matching, against only 14% for a cross-border solar PPA:
-selection.png)
The locality and technology mix move the score more than your sector does: a data centre and a retail office on the same portfolio land within two or three points of each other. You can test your own baseline with the hourly CFE score estimator.
A lower hourly score is not a failing grade. It is a starting point.
"Crucially, the GHG Protocol is an accounting standard. It will not require any company to be 100% 24/7 carbon-free by a given date."
– Killian Daly, EnergyTag, GHG Protocol technical working group member
The point of an hourly score is visibility: a shared baseline that finance, procurement, and sustainability teams can all work from.
"It's hourly accounting, not 100% matching."
– Carolyn Addy, Renewabl's Head of Commercial
Data centre gains emissions visibility
A leading European data centre operator faced a challenge common across the sector: rising electricity demand from AI and cloud computing, alongside growing scrutiny of its sustainability claims.
The operator already ran on 100% renewable energy on an annual basis, but it needed more precise, real‑time visibility. The question had moved on from "Did we buy enough clean power this year?" to "How clean is our power in each hour, and what carbon impact do our PPAs actually deliver?" With energy at roughly 40% of operating costs in many data centres, the answer carries real commercial weight.
Using Renewabl Track, the operator aligned site-level consumption with PPA generation profiles and grid data, then calculated an hourly CFE score and the emissions abated. That gave a live view of when demand was matched with renewables, where PPA output ran short or spilled over, and whether contracted supply delivered the expected carbon impact. The hours a PPA fails to cover are also the hours a buyer pays spot prices, so better hourly cover means a better hedge as well as a stronger claim.
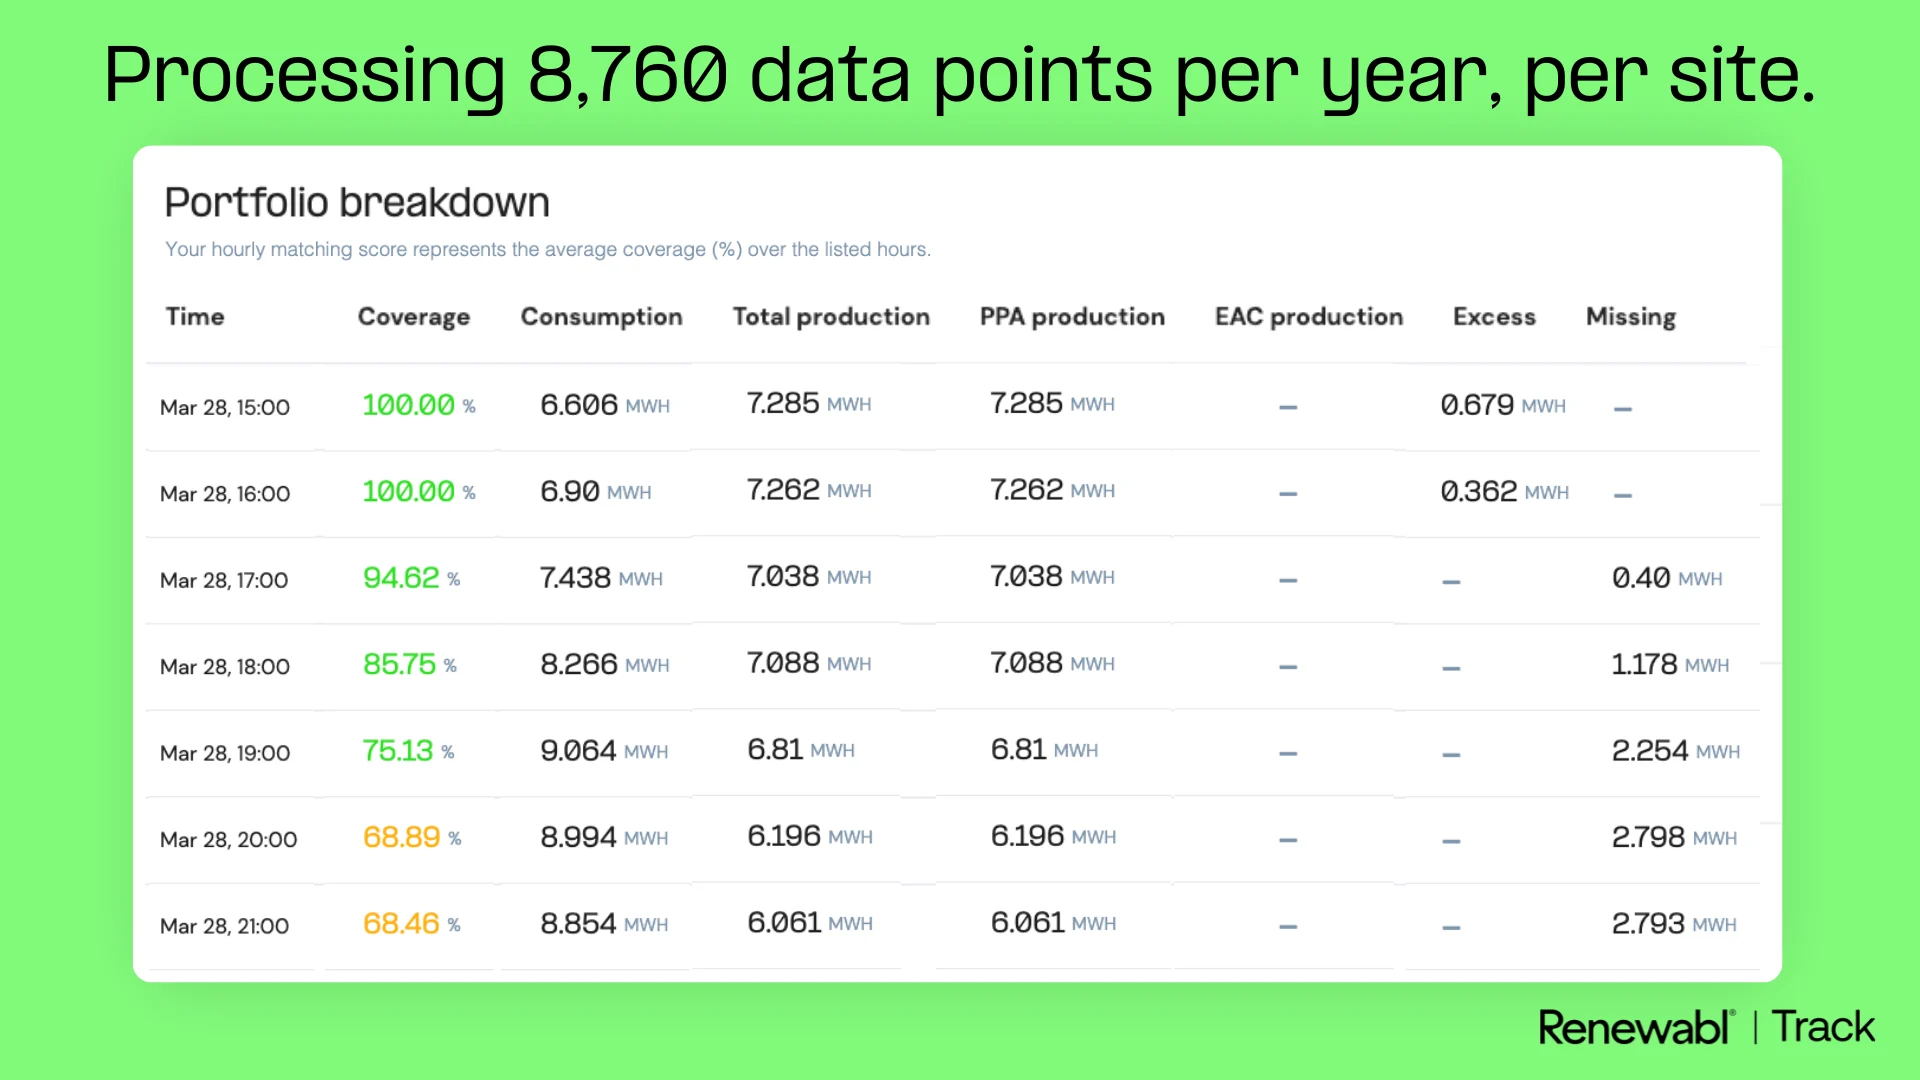
The operator moved from annual matching to hourly renewable accounting, verified CO₂ reductions linked to each PPA, built stronger readiness for evolving EU disclosure rules, and gained clearer "clean compute" evidence for AI and cloud customers. This hourly matching case showed how a data centre can close the gap between sustainability reporting and real impact as it targets net-zero by 2030.
Read the full data centre case study for how the operator set the standard for clean compute transparency.
Consumer goods leader pilots hourly energy accounting
A global consumer goods company wanted to stress-test its Scope 2 position as GHG Protocol rules move towards hourly matching. It could report 100% renewable electricity annually through PPAs, GOs, and on-site generation, but it couldn't prove clean power hour by hour. Its annual GOs lacked production-time data, which made hourly Carbon‑Free Energy (CFE) coverage impossible to calculate.
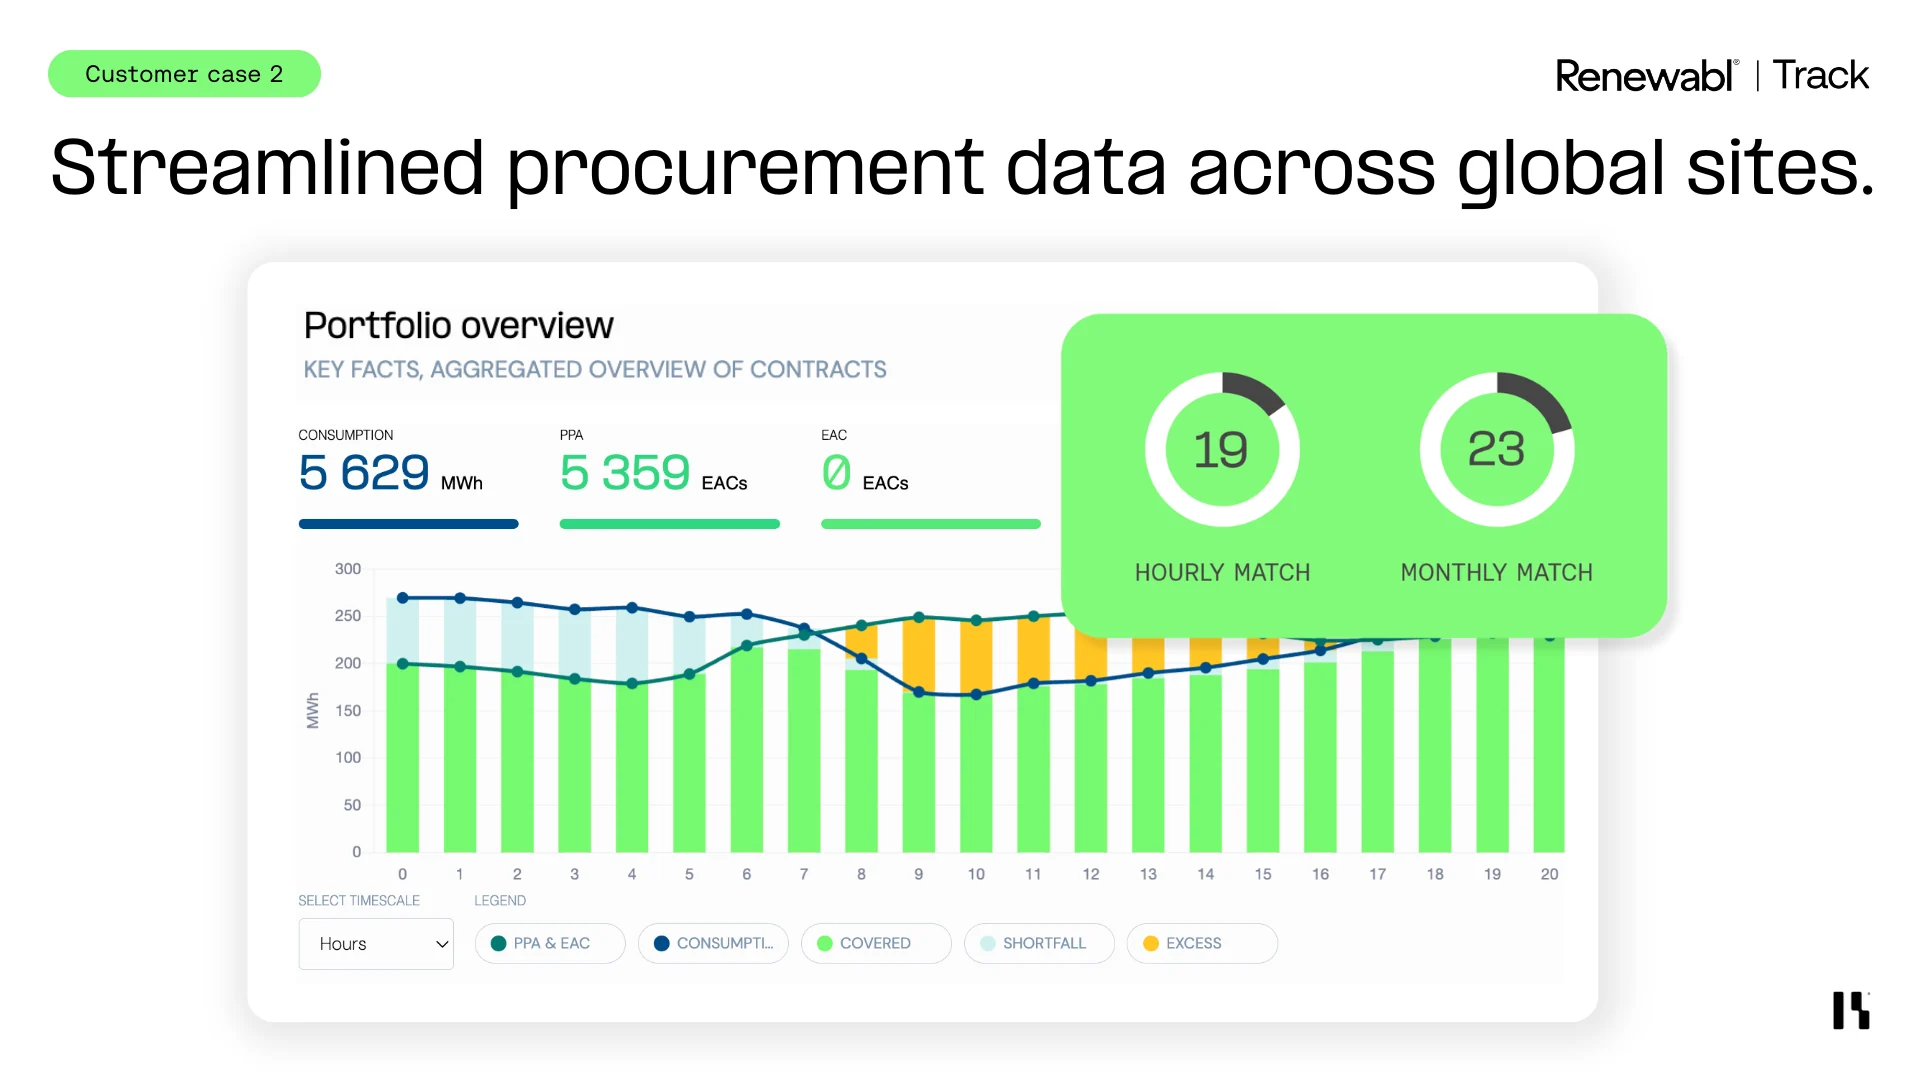
The company ran a pilot in Germany. Using Renewabl Track, it brought all its metered consumption data for the site into one place. A reconciliation feature allocated annual certificates by month, revealing the true monthly CFE coverage. Renewabl then mapped hourly consumption against existing PPAs, on-site generation, and proxy solar and wind profiles to estimate hourly matching and show where the gaps sat across the day.
The pilot returned a 69% hourly match and a 74% monthly match: an audit-ready baseline, a clear view of which contracts counted toward future reporting, and a sense of the effort needed to lift the score over time.
CFE score example calculation
Renewabl calculates a CFE Score as the share of a buyer’s load that is matched by CFE in the regional grid. It can be measured annually, monthly, weekly, or hourly. Where data allows, we recommend hourly resolution. Longer-period scores (daily, monthly, annual) are volume-weighted averages of the hourly scores.
CFE Score % (h) = [Contracted CFE (MWh) + Default Delivered CFE (MWh)] / Load (MWh)
CFE Score is capped at 100%. Any contracted CFE above Load for the hour is ignored.
Example calculation
In the UK, in hour 1, the buyer has a load of 10 MWh. They have 5 MWh from a PPA and 2 MWh of EACs generated in that hour. The remaining 3 MWh comes from grid supply.
Default Delivered CFE = 0 MWh
CFE Score % (h) = (5 MWh + 2 MWh + 0 MWh) / 10 MWh
CFE Score for hour 1 = 70%
For the full method, including default delivered CFE and how emissionality is treated, see our CFE and hourly matching methodology.
Read the full consumer goods case study for how the pilot moved the company from annual claims to actionable hourly insights.
Global distributor centralises renewable contracts and consumption
A multinational distributor operating in five countries managed renewable certificates in a fragmented way. Each business unit sourced EACs independently, using spreadsheets and different supplier pools, with no central oversight. That made reconciliation slow, limited corporate visibility, and raised the risk of inconsistencies in both procurement and reporting.
The company adopted Renewabl to centralise Energy Attribute Certificate (EAC) management. The first step was onboarding sites into the platform, more than 40 to date, with tailored buyer and seller guides so local entity managers could upload data and track consumption consistently. The corporate team now has a unified, near real-time view of energy consumption across all regions.
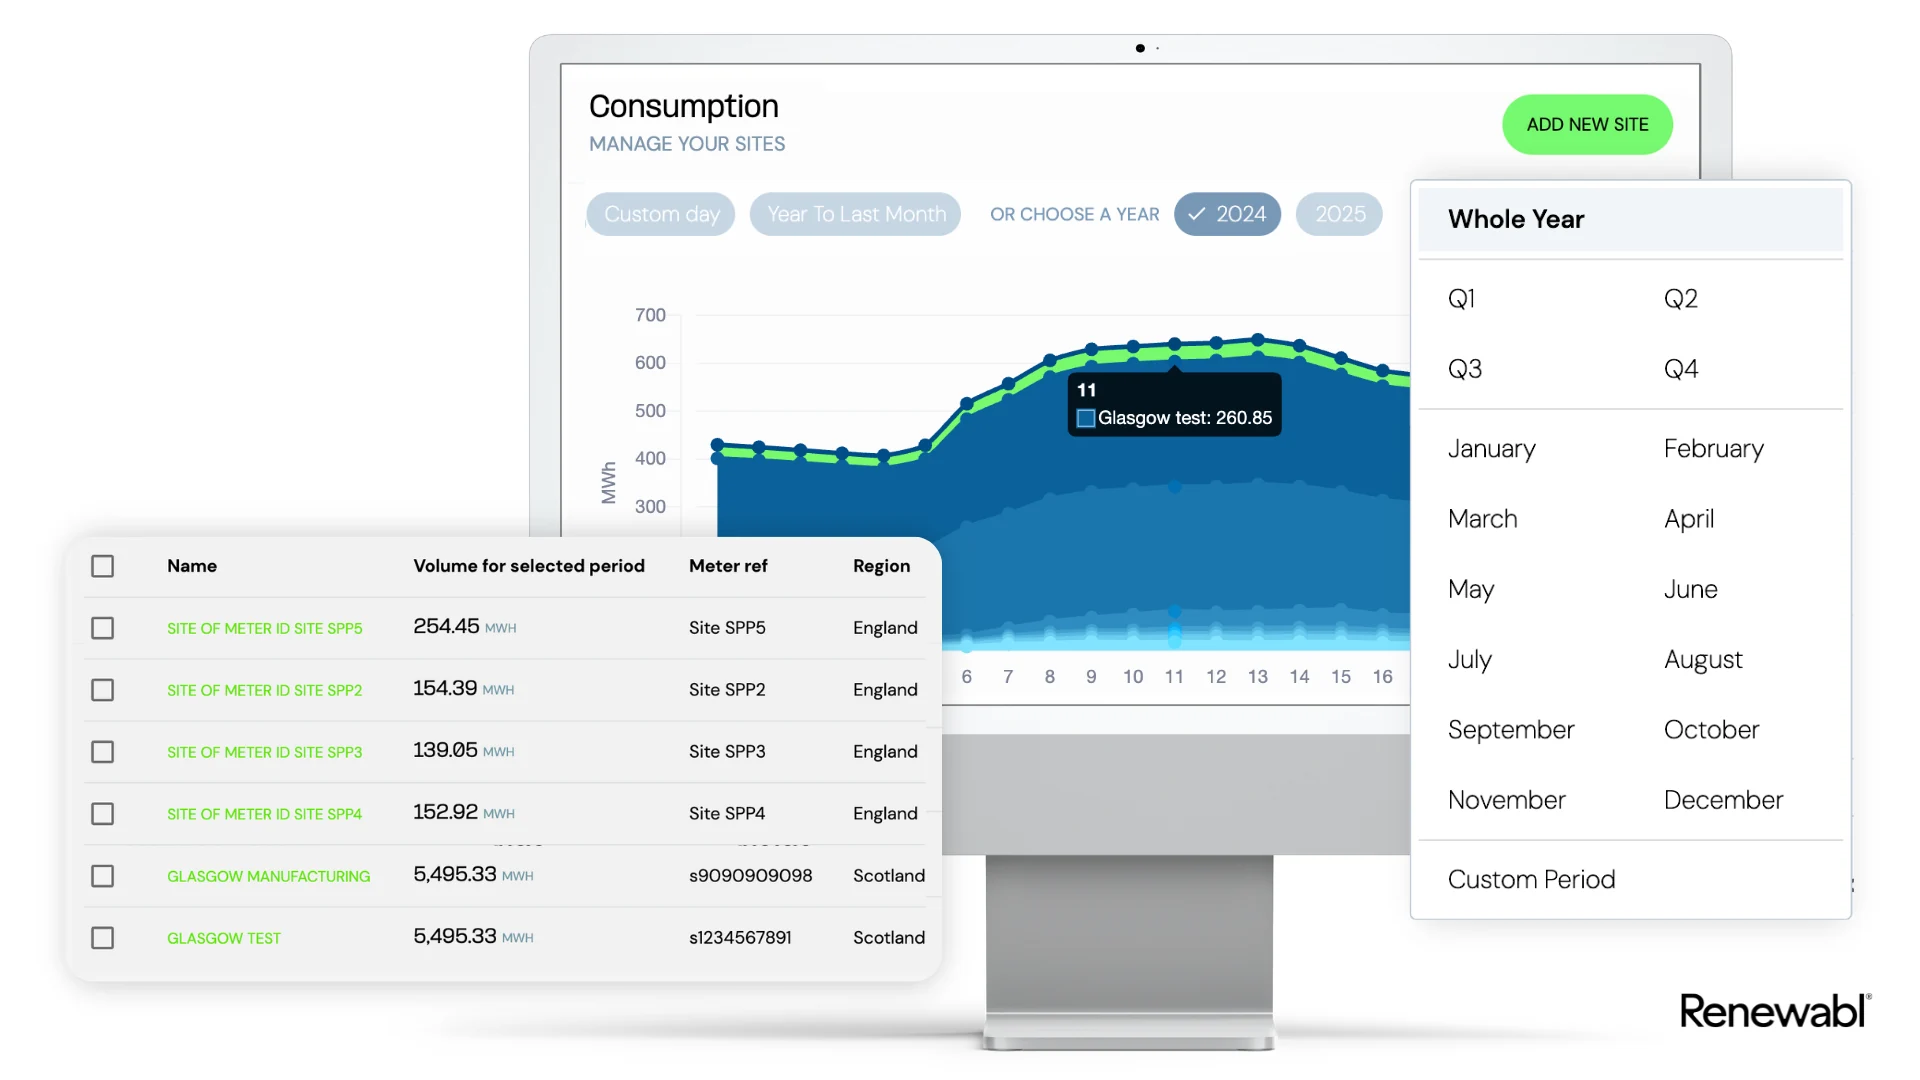
This is renewable energy data management at portfolio scale: unified visibility across countries, standardised procurement workflows, a foundation for quarterly matching, and a roadmap to compare EAC pricing by market and optimise supplier selection. Procurement through Renewabl Trade is the next step.
Read the full global distributor case study for how the group gained one view of EACs across 40+ sites.
How renewable reporting software helps energy buyers
Across these three examples the pattern holds. Annual renewable reporting no longer tells the whole story, and hourly accounting gives buyers a clearer read on both carbon impact and cost exposure.
Data centres track hourly CFE scores and align PPAs with actual load. Consumer goods companies pilot hourly accounting to prepare for the GHG Protocol update and Climate Group standards. Global distributors centralise EAC management across countries, replacing error-prone spreadsheets with one transparent system.
Renewabl combines this platform with market expertise. It was recognised by Verdantix in the 2025 Smart Innovators report on Renewable Energy Procurement Software, with market-leading scores across procurement workflow, tracking, and sustainability integration.
The practical starting point is the same in every case: visibility.
"First things first: get visibility of your data. You need clear, hour-by-hour visibility to meet new rules, and to spot procurement opportunities."
– Carolyn Addy, Renewabl's Head of Commercial
You can estimate your own baseline with the hourly CFE score estimator. If you'd like to talk through any of these renewable energy case studies, or a sustainable energy case study for your own sites, get in touch via the form below or email hello@renewabl.com.