A cross-border virtual Power Purchase Agreement (vPPA, also called a financial or synthetic PPA) eg. Spanish solar or Finnish wind sold to a buyer based elsewhere in Europe, typically looks cost effective at first. We set out to test how well it actually protects electricity costs. We modelled four procurement strategies, from a single cross-border vPPA to optimised in-country PPAs, and a completely unhedged baseline. We read each strategy in a good, a median and a bad year (P90, P50 and P10 respectively).
The short answer: on expected cost all three hedged strategies had similar costs in a 'normal' market pricing scenario, the difference between them comes down to risk. Choosing in-country PPAs strips out 85–91% of a buyer's cost uncertainty, whereas a single cross-border vPPA removes only about 40% and runs roughly 29% more expensive in a ‘bad’ year (the P10 case, or worst 1 in 10 outcomes). The cheapest structure carries the most risk in a bad year.
Executive summary
This analysis set out to test one question: does a single-transaction cross-border vPPA, which looks like the cheapest way to hit renewable energy targets, actually protect a buyer's power bill?
We modelled four procurement strategies across 1,000 ten-year price simulations in four European markets: a single cross-border vPPA, multiple in-country PPAs (virtual or physical), technology-optimised in-country PPAs (virtual or physical), and a completely unhedged approach. The buyer's demand sits in four markets – France, Italy, Germany and Spain – while supply is drawn from Spain and Finland for the cross-border vPPA, and from the buyer's own four markets for the in-country strategies. The price assumptions draw on Pexapark's ten-year European PPA price benchmarks (June 2026).
The analysis finds:
- On expected cost, the three hedged strategies finish in a near-tie – all within about €1/MWh, at around €50/MWh.
- What separates them is risk: in-country procurement reduces ten-year cost uncertainty by 85–91%, compared with only about 40% for the cross-border vPPA, whose bad-year cost runs roughly 29% higher than the optimised in-country mix.
- A key cost driver is the country where the contract settles. A cross-border vPPA pays out in the generator's market, not the buyer's, leaving basis risk that settling in-country eliminates.
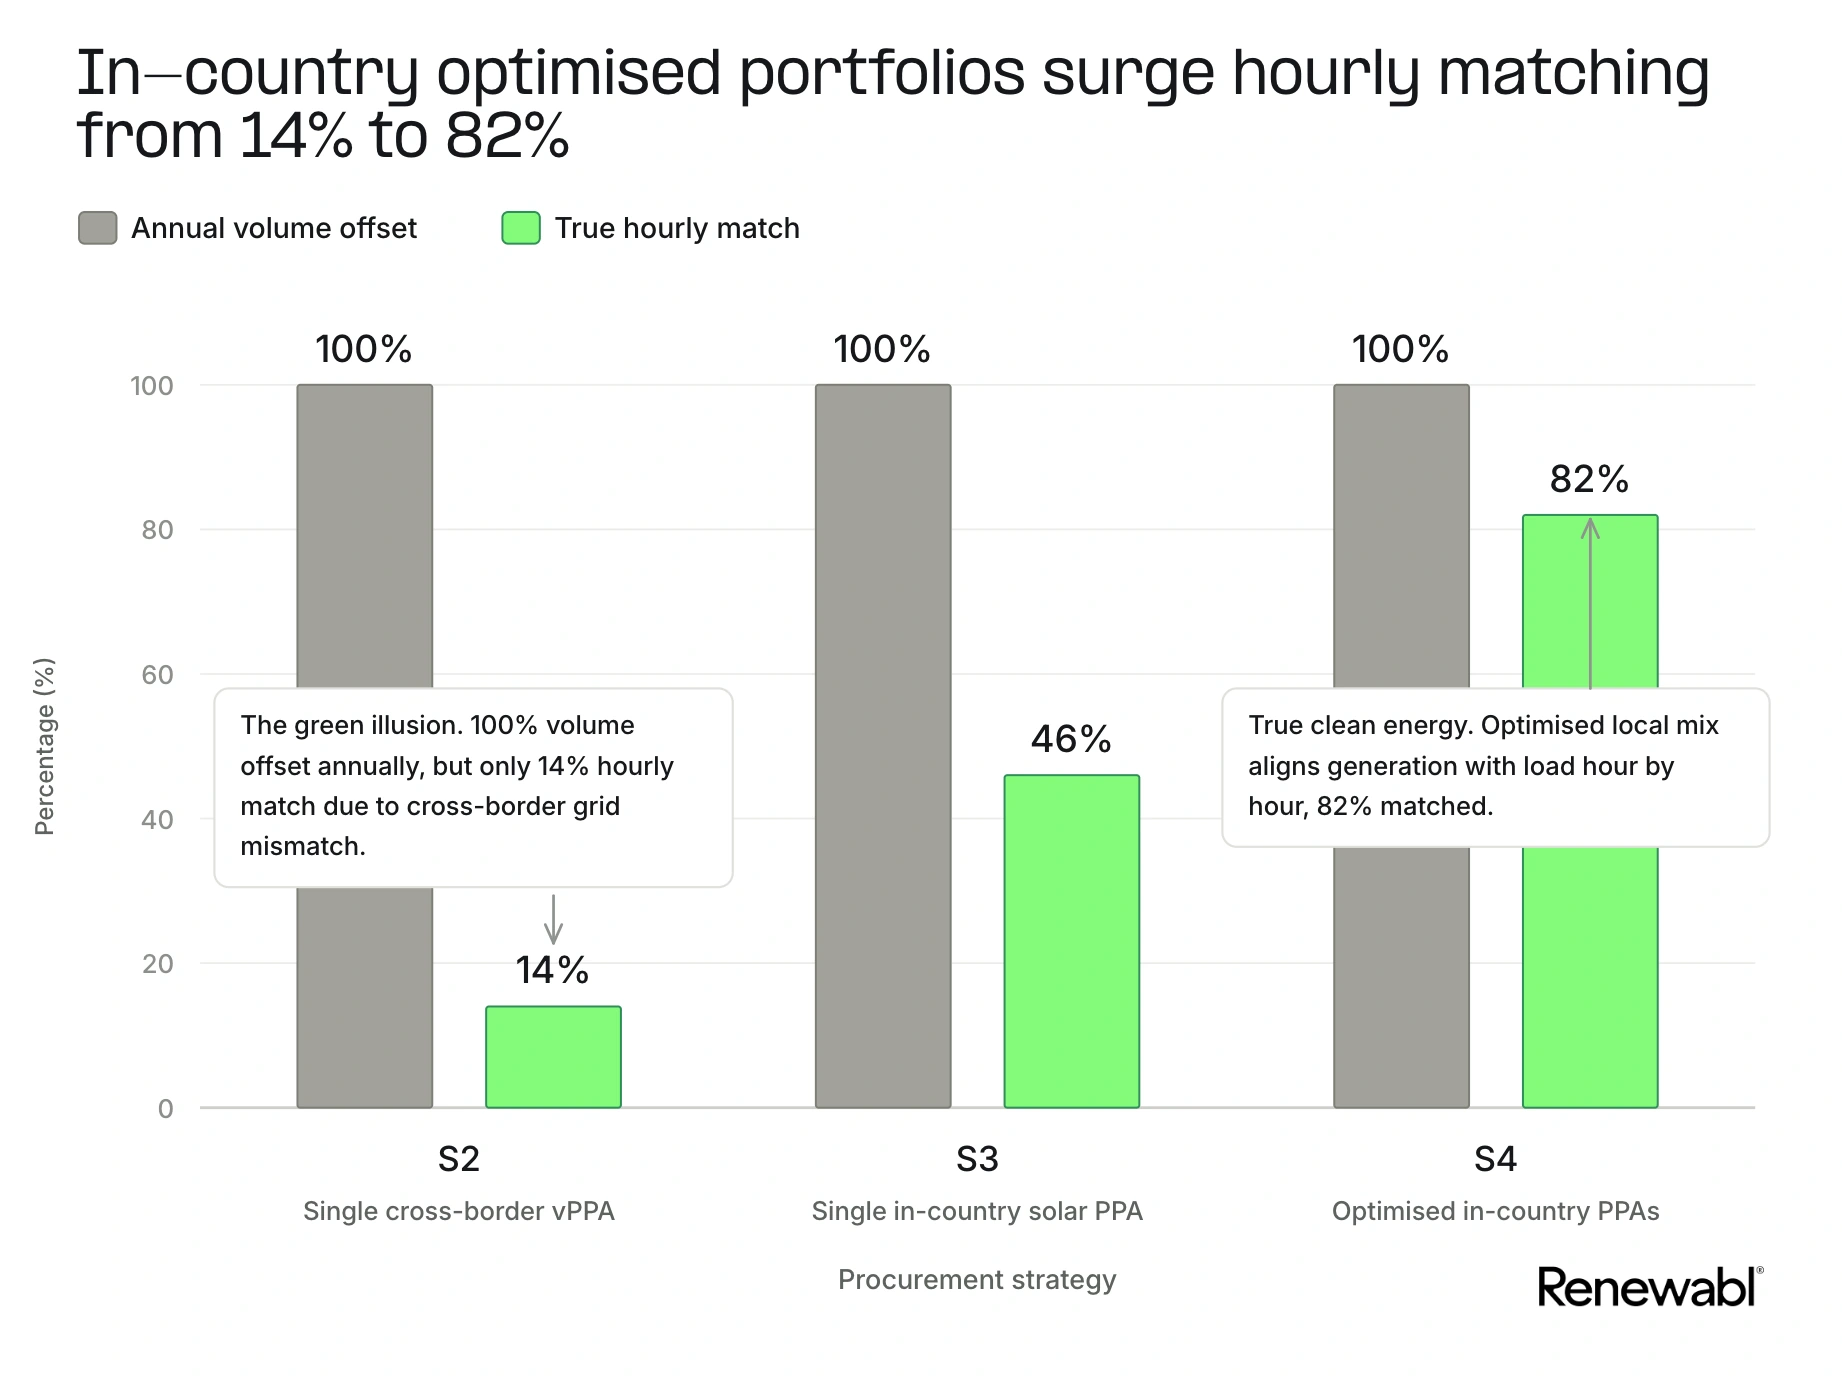
- The best-hedged strategies also score highest on hourly matching – about 82% against load, versus 14% for the cross-border vPPA. That gap barely registers under today's annual Scope 2 accounting, but it grows far more relevant under the proposed hourly rules.
- The advantage holds across every load profile tested, from a flat 24/7 data centre consumption pattern to a retailer with morning and evening peaks.
European policies and global accounting standards are considering a move from annual averages to hour-by-hour tracking and reporting of clean electricity consumption. Our analysis shows such a change can bring lower electricity costs and reduced exposure to price volatility. The same hourly view that supports a stronger Scope 2 claim also helps the energy buyer build a more resilient portfolio.
Why we tested cross-border vPPA basis risk
Most European corporations buying renewable energy are trying to satisfy two stakeholders at once: a sustainability manager with a renewable-energy target to hit, and an energy buyer with a budget to defend and a portfolio to keep stable.
To satisfy both, companies have often turned to cross-border vPPAs – for example Spanish solar or Finnish wind, markets with abundant resources and comparatively low strike prices, sold to a buyer whose operations sit elsewhere in Europe. This works because the EU's Guarantee of Origin (GO) system, run via the Association of Issuing Bodies (AIB), treats most of Europe as a single market: a GO issued in Spain can be retired against annual consumption in any other AIB member country. For the mechanics of how these contracts are structured, see our guide to corporate Power Purchase Agreements. They are well-priced and the legal templates are mature – but the headline strike is not the whole story.
The question we test is whether a cross-border vPPA's basis risk makes its true cost higher than the strike suggests. Basis risk here is the gap between the price where the project generates – the Spanish or Finnish hub – and the price where the buyer actually consumes. When those two markets move out of step, a contract that looked cheap stops protecting the bill.
The exposure is live: Spain logged 397 negative-price hours in Q1 2026, up from 48 a year earlier, and falling solar capture factors mean the cannibalisation that weakens a Spanish-solar vPPA is still worsening. The 2022 gas crisis, when the loss of Russian gas pushed European power to record highs in gas-setting hours, is the kind of shock a ten-year hedge is meant to cover.
To test it, we modelled a representative pan-European corporate with 100 GWh of annual load split equally across France, Italy, Germany and Spain (25 GWh per country – broadly the footprint of a small data-centre cluster, a regional retail estate, or a manufacturing site). The 100 GWh load is illustrative: the €M figures scale linearly with volume, while the €/MWh figures do not change.
The four PPA procurement strategies we compared
- S1 – Unbundled GOs only. Buy all power from the spot market and bolt on unbundled GOs (we assume €2.5/MWh over the horizon) to reduce the supply's Scope 2 footprint.
- S2 – Single cross-border vPPA. Buy the full volume virtually from outside the buyer's zones. We use 100% Spanish solar as the headline case,the cheapest and most frequently transacted variant, and also test 100% Finnish wind and a 50/50 blend. The vPPA settles at the generator's hub while the buyer keeps consuming at its local prices, so there is no direct hedge of its electricity costs.
- S3 – Single in-country solar PPA. A 25 GWh solar PPA, physical or virtual, in each country. A deliberately single-technology test that isolates the value of in-country settlement.
- S4 – Optimised in-country PPAs. The same in-country approach, but with the wind/solar split optimised in each country to best match the load profile. The best level of hourly matching analysed is 82% across the portfolio.
Solar is the single technology in S3 because it has dominated European corporate vPPA volumes in recent years, and because it reflects where many corporates are today: they have signed their first solar vPPA and are looking to move on from it. S4 tests what they gain by moving to an optimised wind/solar mix.
How we modelled it: 1,000 Monte Carlo price paths
The full methodology is in the PDF. The short version: a Monte Carlo settlement engine simulates 1,000 plausible ten-year paths (2027–2036) for hourly spot prices across the five in-scope markets (France, Italy, Germany, Spain, Finland), then runs each strategy through every path and reports the distribution of outcomes. A few choices shape how to read the numbers:
- Hourly settlement. Every cashflow runs on 8,760-hour shapes for generation and load, so basis risk in the stressed hours is not smoothed away by monthly averaging.
- PPAs settle pay-as-produced.
- vPPA strikes are anchored to live market benchmarks – Pexapark's ten-year strike observations per market and technology (June 2026), with forward curves from traded EEX baseload calendars.
- Cost framing. All €/MWh figures are ten-year NPV cashflows discounted at 5% to 2027, divided by undiscounted consumed MWh (one million MWh over the ten years).
The model also runs three buyer archetypes – a flat 24/7 data centre, a retailer with morning and evening peaks, and a midday-centred manufacturer – and applies solar and wind cannibalisation hour by hour. Find the full methodology in the analysis.
Results
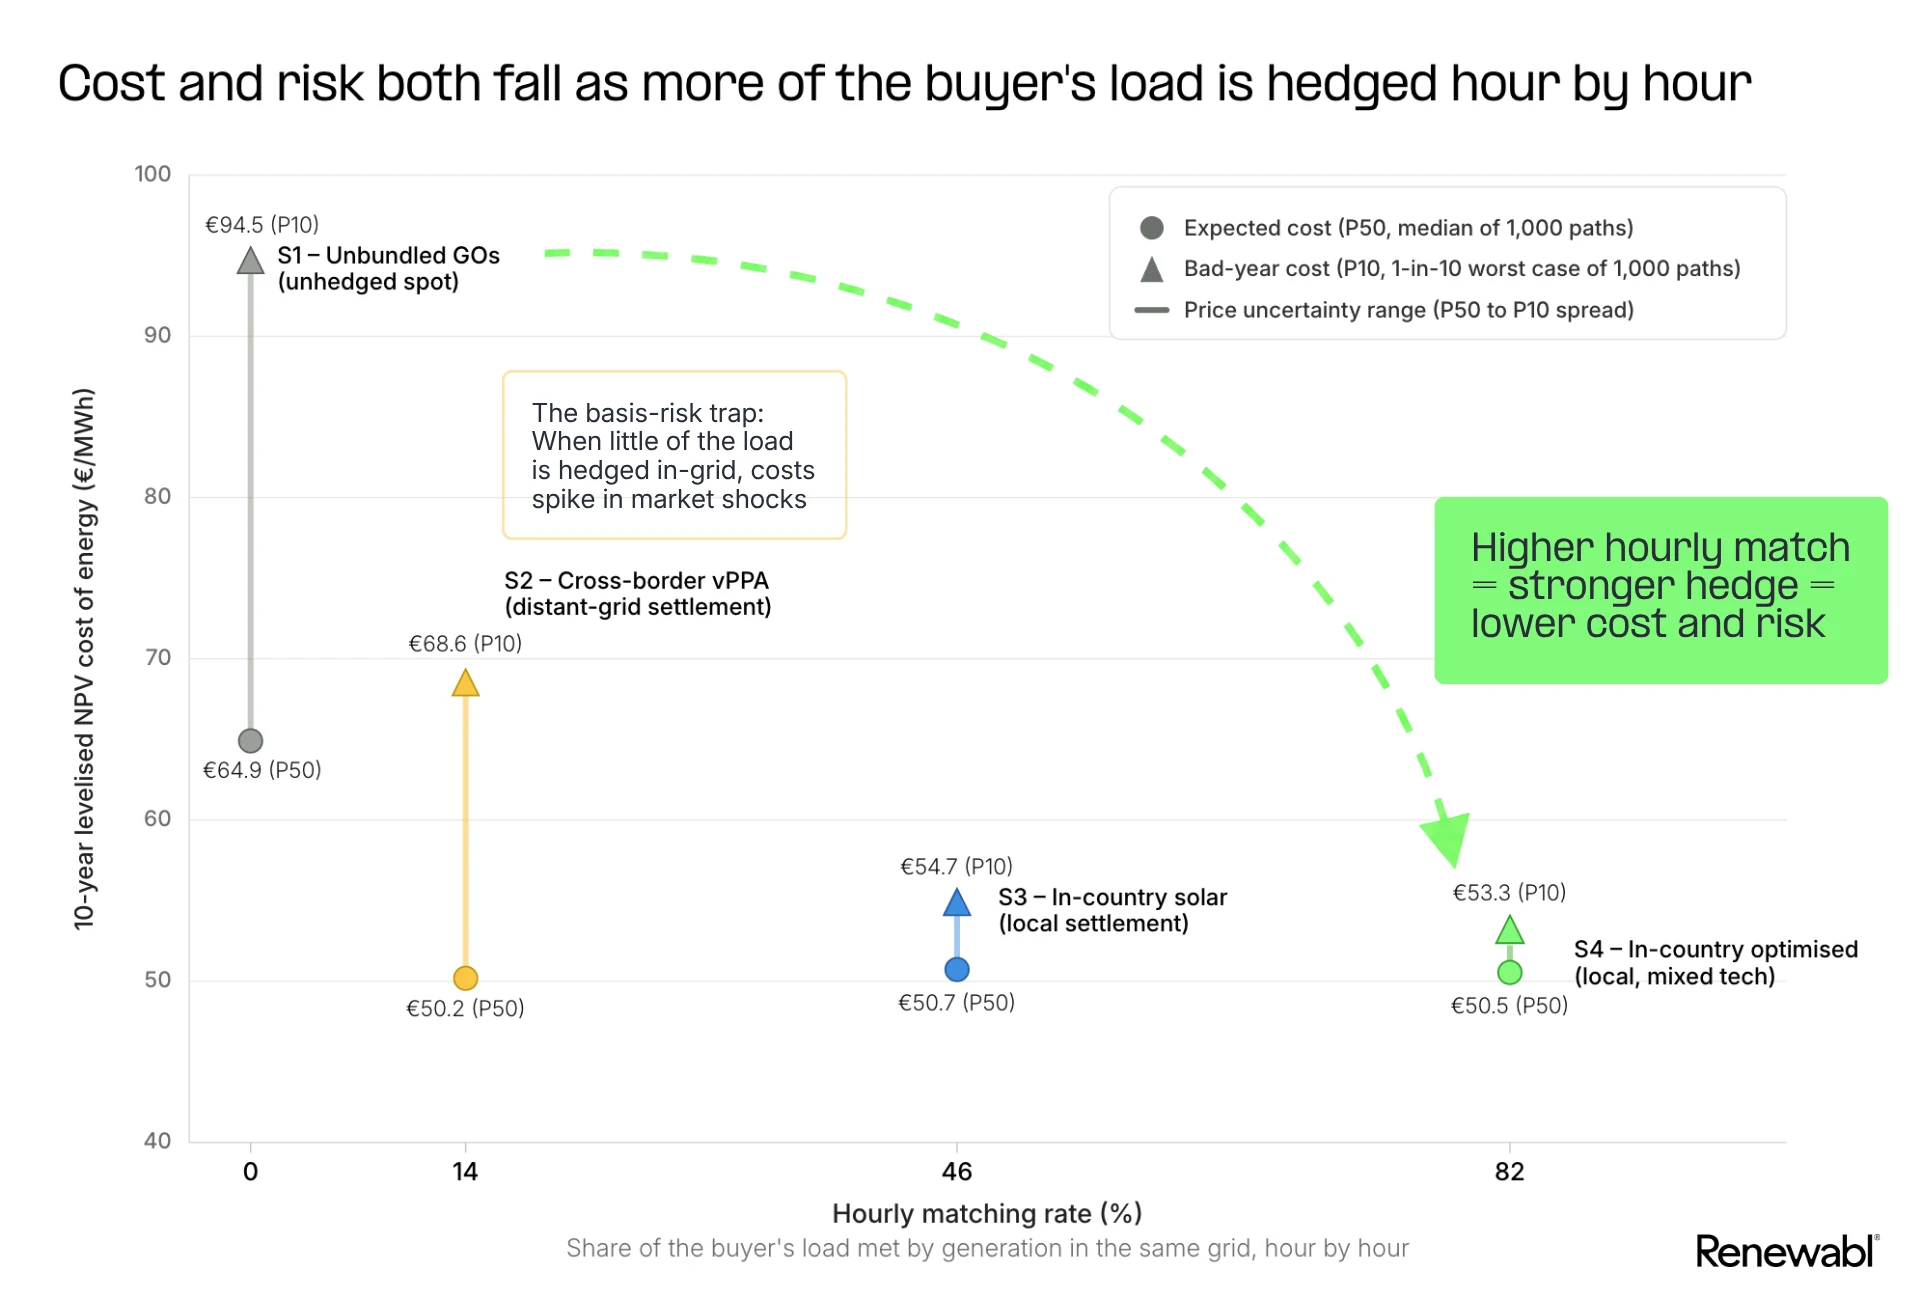
The strategies with the greatest effective hedge for the buyer are also among the least expensive. Not hedging is the most expensive and the most volatile. Optimised in-country matching is among the cheapest and the most risk-effective. The cross-border vPPA is competitive on expected cost – marginally the cheapest of the hedged strategies – but it leaves large portions of demand exposed to wholesale price volatility, and its bad-year cost is far higher than either in-country option.
Expected cost: in-country and optimised matching come out cheapest
The unhedged S1 portfolio costs €64.9/MWh. The three hedged strategies land within roughly €1/MWh of each other, around €50–€51, with the cross-border vPPA marginally the cheapest (€50.2/MWh, versus €50.5 for S4 and €50.7 for S3). The three sit within about €0.6/MWh of each other; the difference shows up in the bad year, not the median.
These are realised ten-year portfolio costs, not contract strike prices. A headline solar strike can look very cheap, but once cannibalisation, generation shape and the cost of serving unmatched hours are accounted for, the delivered cost lands well above the headline. A low strike price does not mean a low bill.
In-country PPAs settle in the buyer's own market, so the price the PPA settles against stays correlated with the price the buyer pays, even when solar generates at noon rather than at the buyer's evening peak. When prices climb, there is a stronger correlation and a higher likeliness that PPA offsets the higher bill. S4 narrows the timing gap further by optimising the technology blend for the load profile.
Volatility and tail risk: what a clean-power hedge is worth
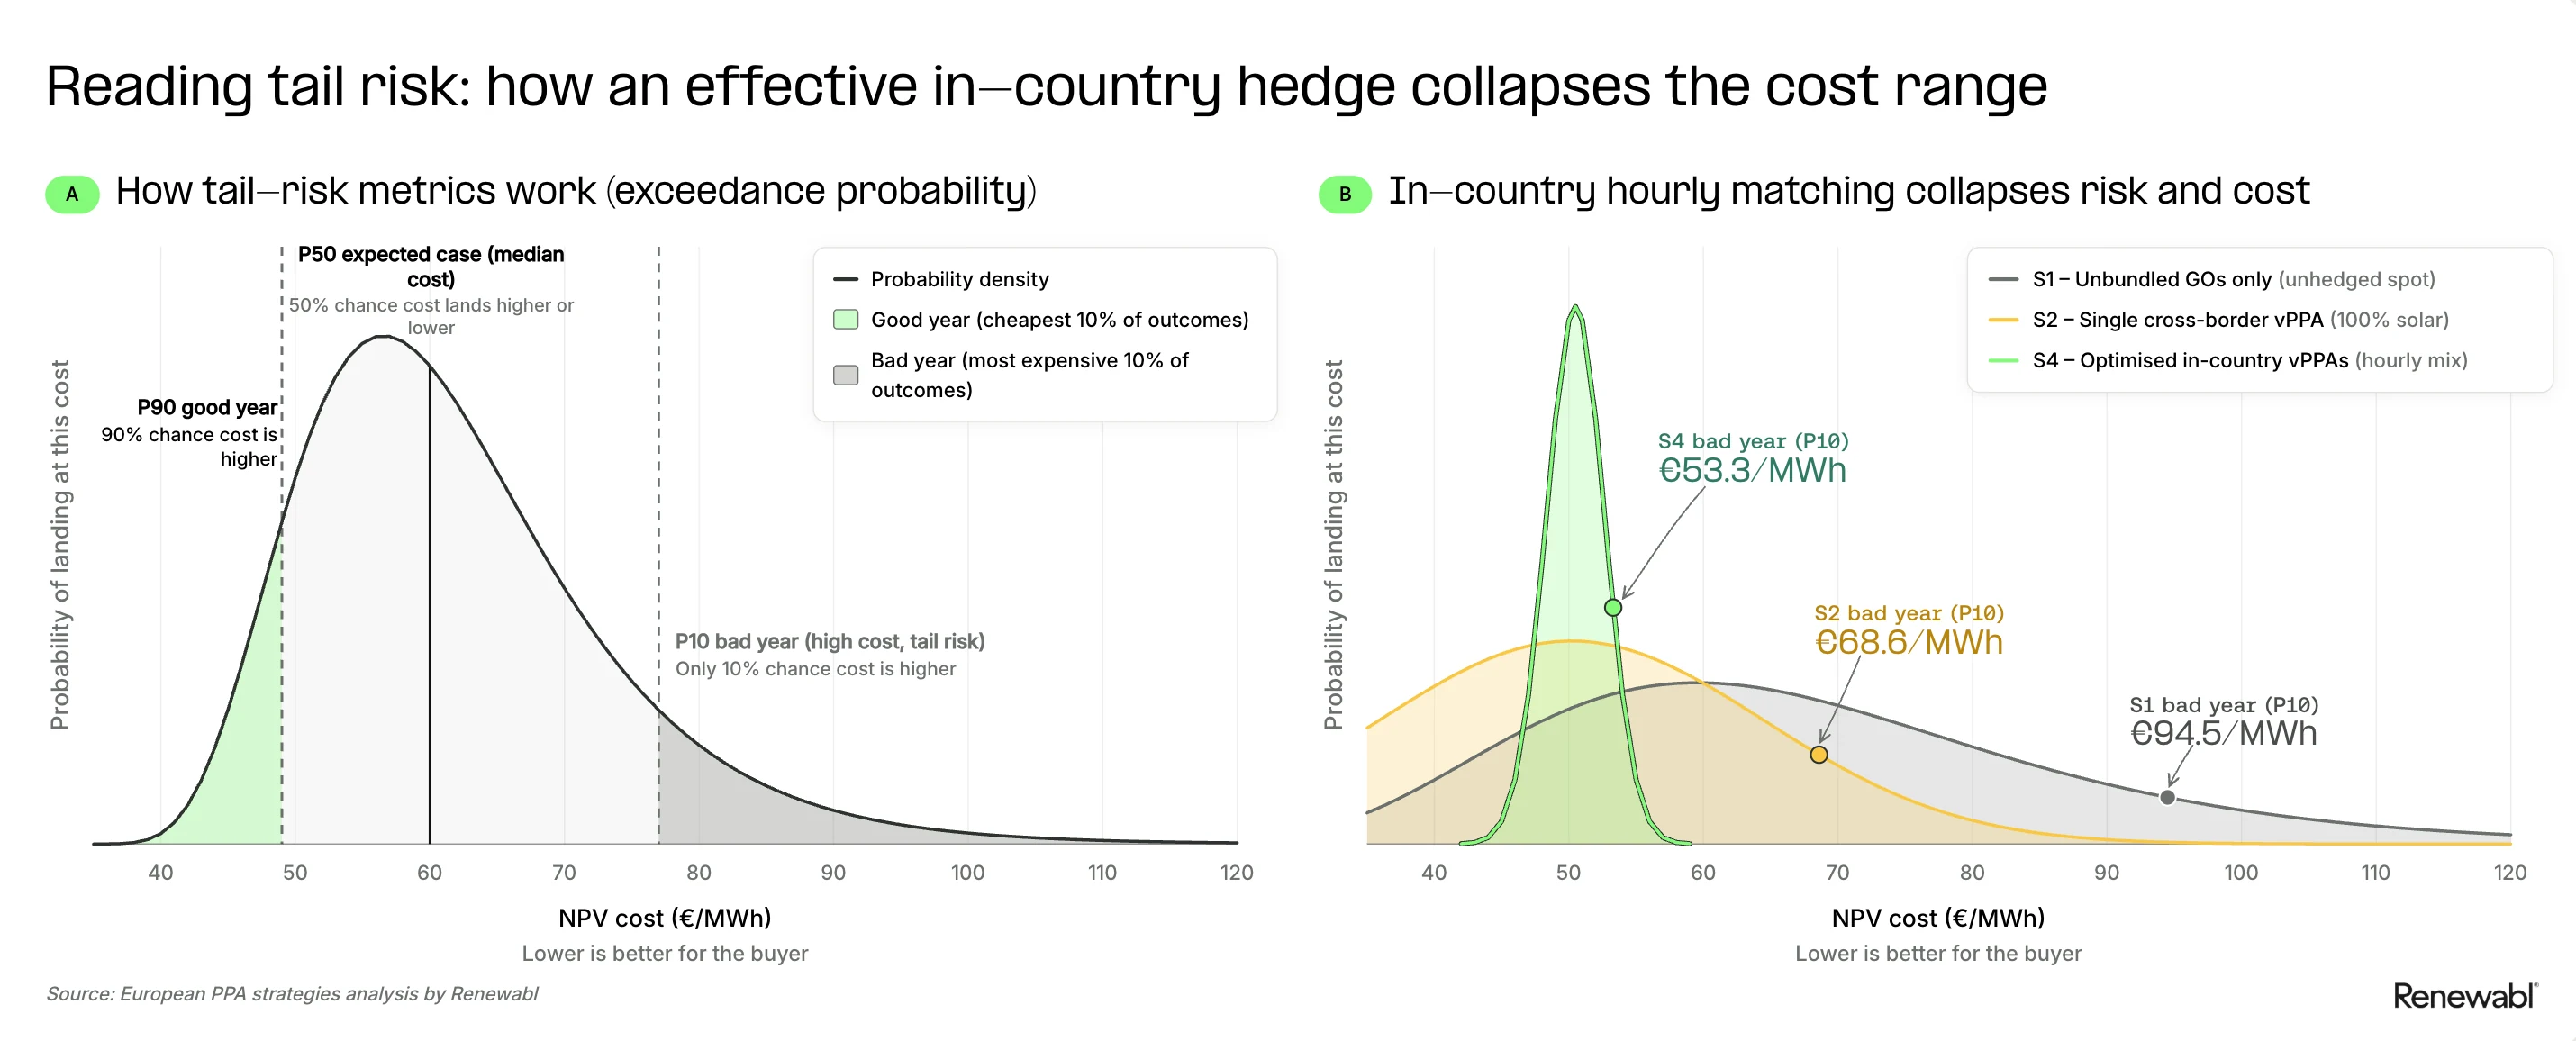
Cross-border vPPAs have marginally lower expected costs, but the tail risk is where in-country PPAs prove critical. We focus on the bad-year cost (P10): the level only 1 in 10 modelled paths comes in worse than, quoted as a levelised €/MWh across the full ten years, so a bad year means a bad ten-year path – including 2022-style shocks. For a buyer worried about price spikes, P10 matters more than the median.
The unhedged S1 has a P10 cost of around €94.5/MWh, roughly €30/MWh above its median. The cross-border vPPA's P10 is €68.6/MWh, about 37% above its expected case. The in-country strategies almost eliminate that variance: S3 costs about €4/MWh more than its median in a bad year, and S4 only €2.8/MWh more.
Put as variance reduction, the in-country strategies remove 85% (S3) and 91% (S4) of the buyer's ten-year price uncertainty, against about 40% for the cross-border vPPA – and the cross-border vPPA's bad-year cost is 29% higher than the optimised in-country option.
In a 2022-style shock, all four buyer markets spike together – yet the cross-border vPPA settles only at the generator's hub, where Iberian and Nordic prices do not always move in step with Continental ones. When those correlations break down, the vPPA's payout fails to offset the buyer's worst hours. In-country PPAs settle against the same market that sets the buyer's bill, so so the two prices move together.
Does your load profile change the result?
Barely. We ran every strategy against the three archetypes – a flat data centre, a peaky retailer and a midday manufacturer – and the cost ranking held in all of them: the unhedged option is always dearest, and in-country supply matched to the load shape is the strongest protection against the costliest years.
What this means for PPA buyers
The first decision is whether to hedge at all. Buying unbundled GOs is the most expensive option and the most exposed in a bad year. Once you are hedging, the choice comes down to where the contract settles (cross-border carries basis risk; in-country does not), how many counterparties you can manage, and how to optimise a technology blend that matches your demand.
The technology mix inside a cross-border vPPA shifts the expected price level – the 100% solar and 100% wind variants are about €16/MWh apart – but not the basis-risk structure; whether to run one at all is the risk-appetite question.
Moving from a single cross-border vPPA to multiple in-country agreements buys material risk reduction, but it can add upfront legal, advisory and management cost as the portfolio splits across national contracts. One way to manage that is to build the portfolio in stages. Pexapark notes growing interest in shorter, five-to-ten-year PPAs from operational assets, which can secure savings sooner, alongside longer new-build contracts where additionality is the priority.
The overlap with Scope 2 reporting
The strategies that hedge cost most effectively are also the ones that match generation to consumption hour by hour. S4 reaches about 82% hourly matching against load – the closest of the four to 24/7 carbon-free energy (CFE) – S3 around 46%, and the cross-border vPPA only about 14%. Today's annual Scope 2 accounting treats all four as equivalent on the renewable claim; hourly accounting would not.
A proposed transition from annual to hourly Scope 2 reporting would reward procurement that hedges effectively. A buyer's hourly CFE score is, in effect, an indicator of where they sit on the cost-and-risk curve: it shows which hours are covered and which are still exposed to the volatility above. This is the financial read on a number usually treated as a sustainability metric – the same point we make in how to tell if your PPA is really hedging your costs.
Other evidence aligns with this direction: Pexapark and Finergreen both report a 2025 shift towards more structured, domestic and hybrid PPA portfolios, in part because cross-border basis risk has become harder to ignore. At the same time, the International Renewable Energy Agency (IRENA) reports that the cost of firm, round-the-clock renewable power – solar, wind and storage combined – is falling as technology costs decline.
None of this is all-or-nothing. For many buyers the right first move is from annual to monthly matching, with hourly as the direction of travel. Existing PPAs and certificates still count. Hourly-matching analysis is a practical tool for any buyer refining a portfolio: it surfaces which hours are exposed, which technologies and locations cover them, and where storage or extra contracts deliver the most hedge effectiveness per euro spent.
How Renewabl can help
Renewabl is one platform to track, trade and report renewables through an hourly lens. When you run a PPA tender on Renewabl Trade, you can compare proposals on how different structures and technologies fit your demand profile and price area, not just on annual volume or headline price. Renewabl Track compares contracted generation against your actual demand hour by hour, so you can see exposed periods and how hedge performance shifts over time.
This analysis was completed by Paul Hill, Head of Energy Markets at Renewabl, and reviewed by JP Cerda (CEO and Co-Founder) and Ruby Tebbutt (Trade Specialist). Market data provided by Pexapark. This report is for general information only and does not constitute financial, legal or investment advice. All cost figures are modelled scenarios based on the stated assumptions, not forecasts or guarantees of future outcomes.
Suggested citation: Renewabl (2026), European PPA strategies and the hidden cost of cross-border basis risk, with market data from Pexapark.


.webp)

